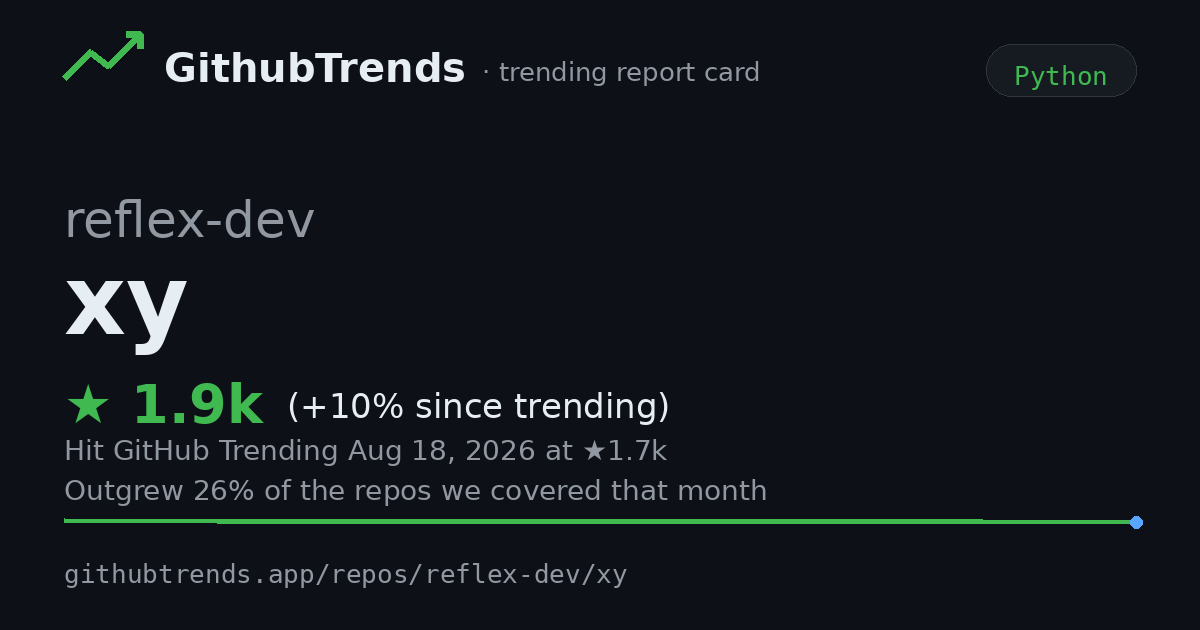
reflex-dev/xy
★ 1,881 stars
Covered in week 2026-W34 · the 2026-08 report
Ultra-fast and customizable Python charts
What xy is
XY is an extremely fast, interactive, customizable Python charting library for the web, notebooks, and static exports.
From the repository README · read it on GitHub →
Transcript
XY rendered a 10 billion point OpenStreetMap dataset using a Rust core that computes only what the screen needs based on resolution. Export charts as HTML, PNG, SVG, or PDF, deploy them in notebooks and web apps, and follow matplotlib conventions for common workflows. XY is currently in alpha. Build flexible Python charts for everyday plots and custom application visuals.